Richard Wicaksono

5+ years of experience in programming and data management. I coded in Python, Java, C++, HTML/CSS, SQL, PHP, and JavaScript. Conducted internships at PT. HK Metals Utama Tbk as a Data Analyst intern and Zi.Care as a Quality Assurance intern.
Currently a Data Conversion Engineer at Nelnet, Inc., creating and developing existing SQL scripts to improve work efficiency and automation. Outside programming, my hobbies include watching and playing soccer, basketball, and badminton.
View My LinkedIn Profile
Tableau Project
Project Background
This was an individual project for the BUS3620 Management Information Systems course during the Fall 2019 quarter. The objective was to enhance our data visualization skills based on the selected datasets.
Assignment Details
Taken from the instructor’s assignment details:
Build a Tableau workbook based on either the Sample – Superstore or World Indicators datasets that come with Tableau with the following features:
- At least one visualization that has a custom calculation
- At least one visualization that has a map
- At least one visualization utilizes motion
- At least one Dashboard
Assignment Outcome
For this assignment, I have created a story which I published in the public Tableau server. For more information, please visit the following link: Richard’s Tableau Story
I decided to select a dataset which represents the GDP Per Capita of EU countries and the hours to do tax for each country. When I stumbled upon this dataset, I was curious if the GDP Per Capita of a country can affect the time taken to prepare and pay taxes. Here are my findings:
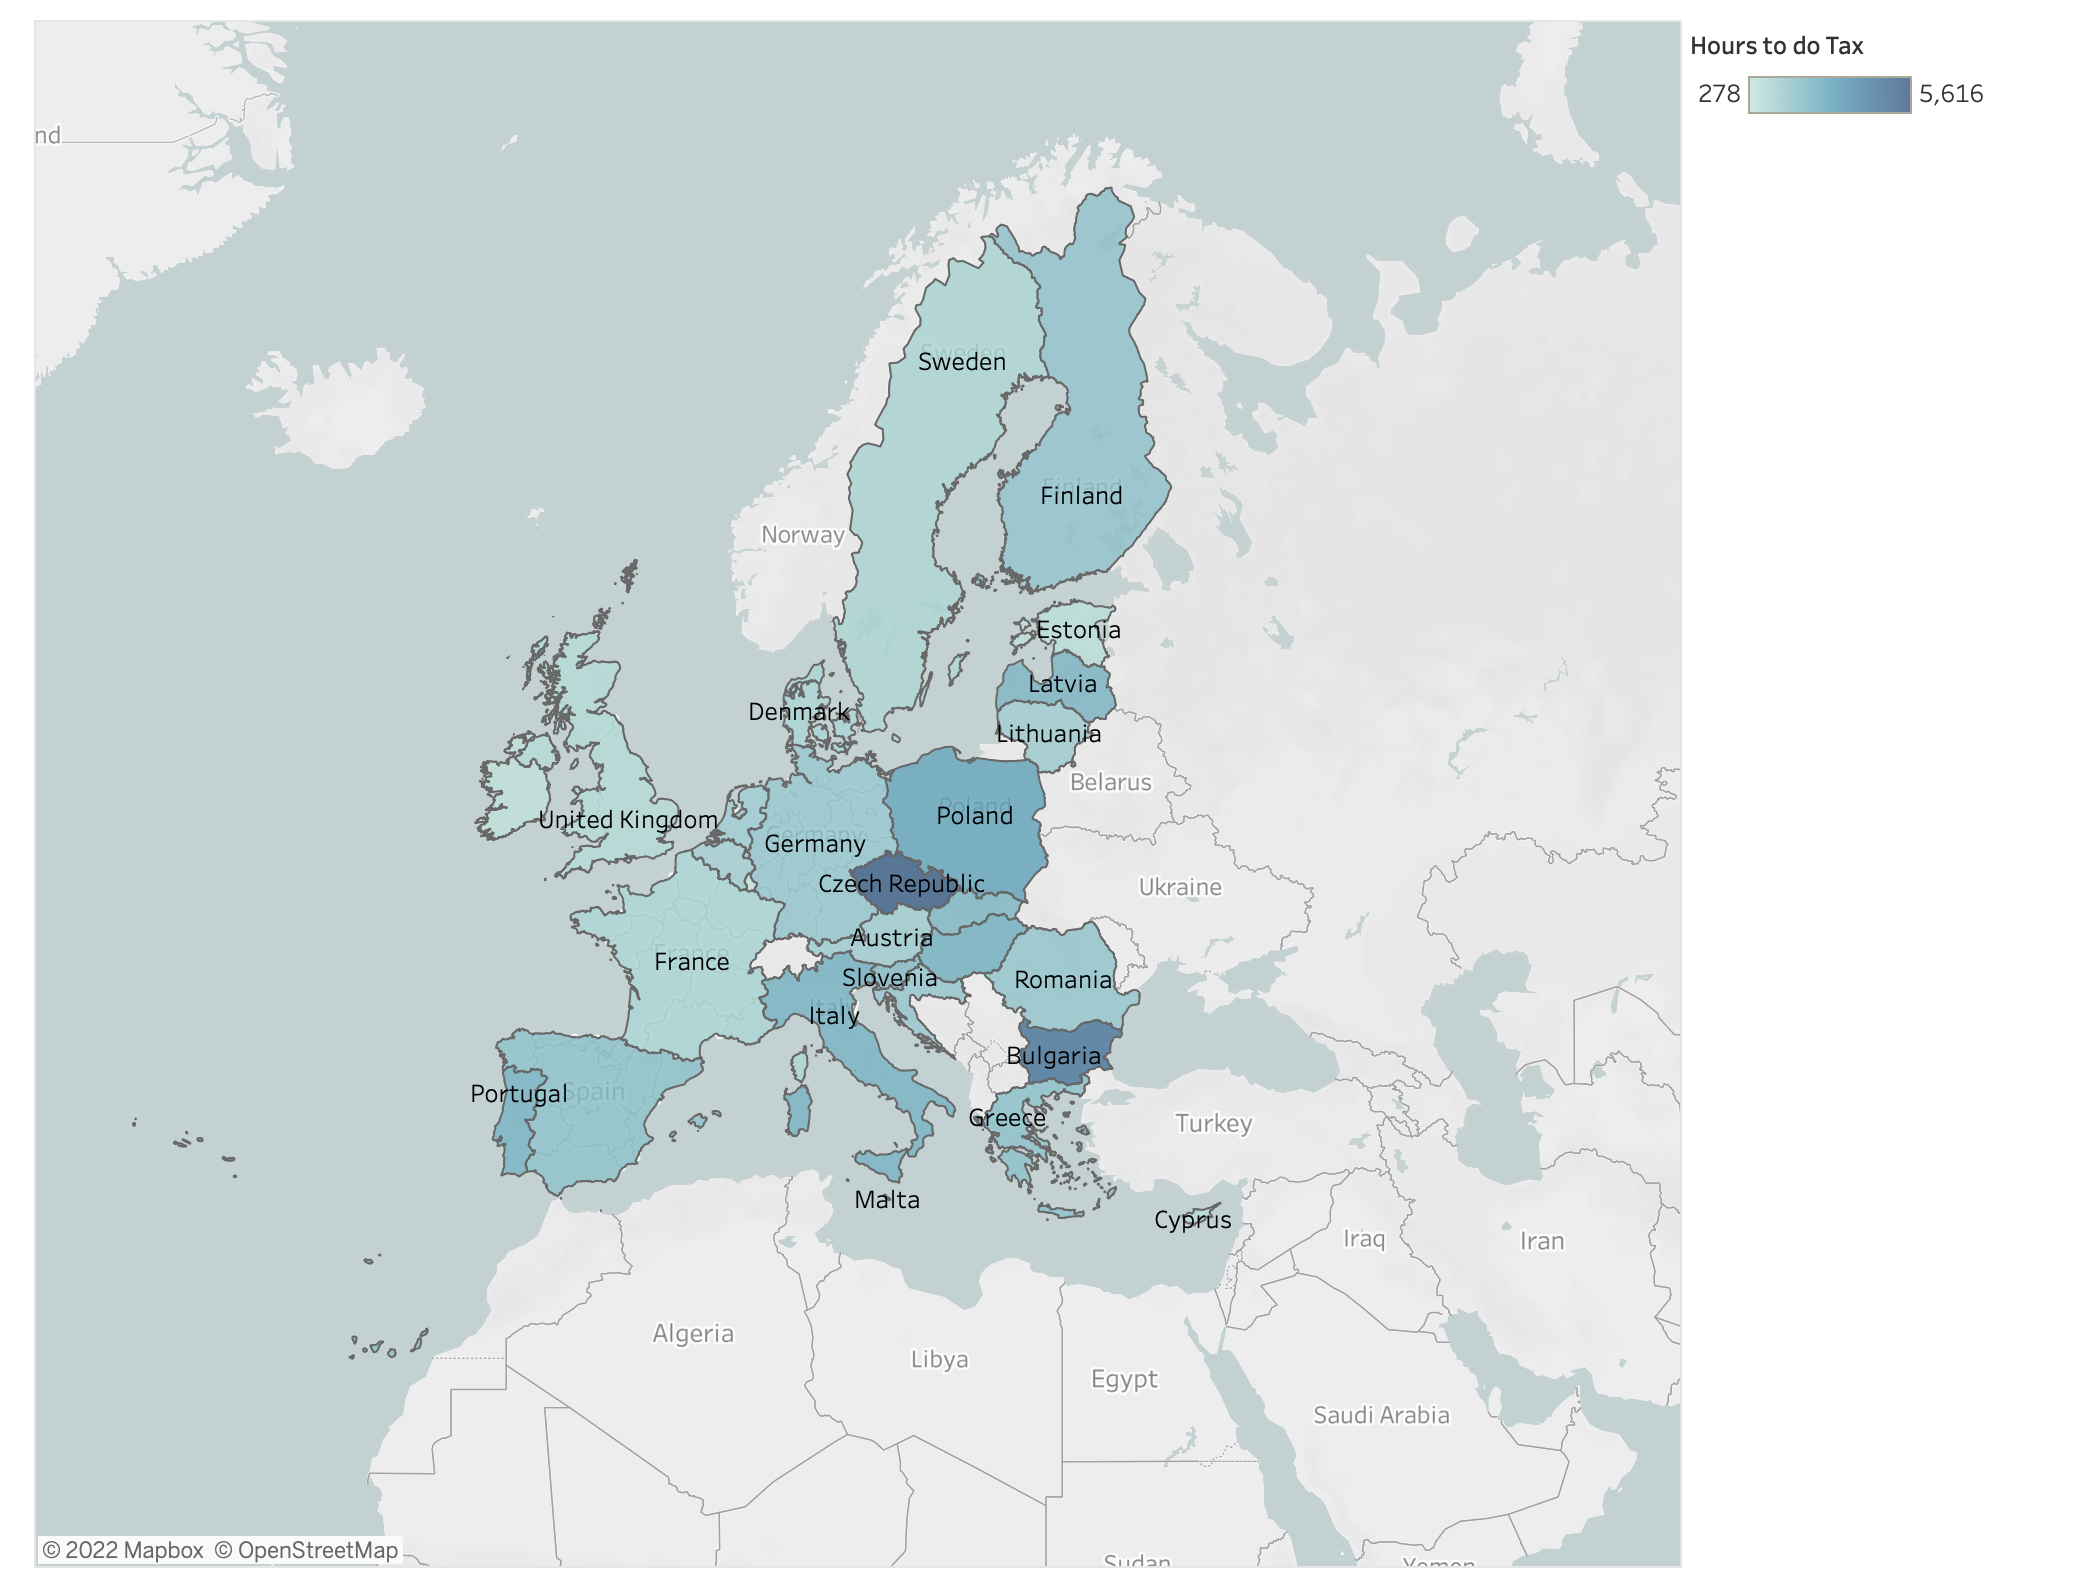
 This is a map chart showing the contrast of each country with their total hours to do tax. Over the course of 8 years (2005-2012), Czech Republic has the highest amount of hours to do tax, which summed to about 5,616 hours. Meanwhile, Luxembourg has the least amount of hours to do tax, which only totaled to about 413 hours.
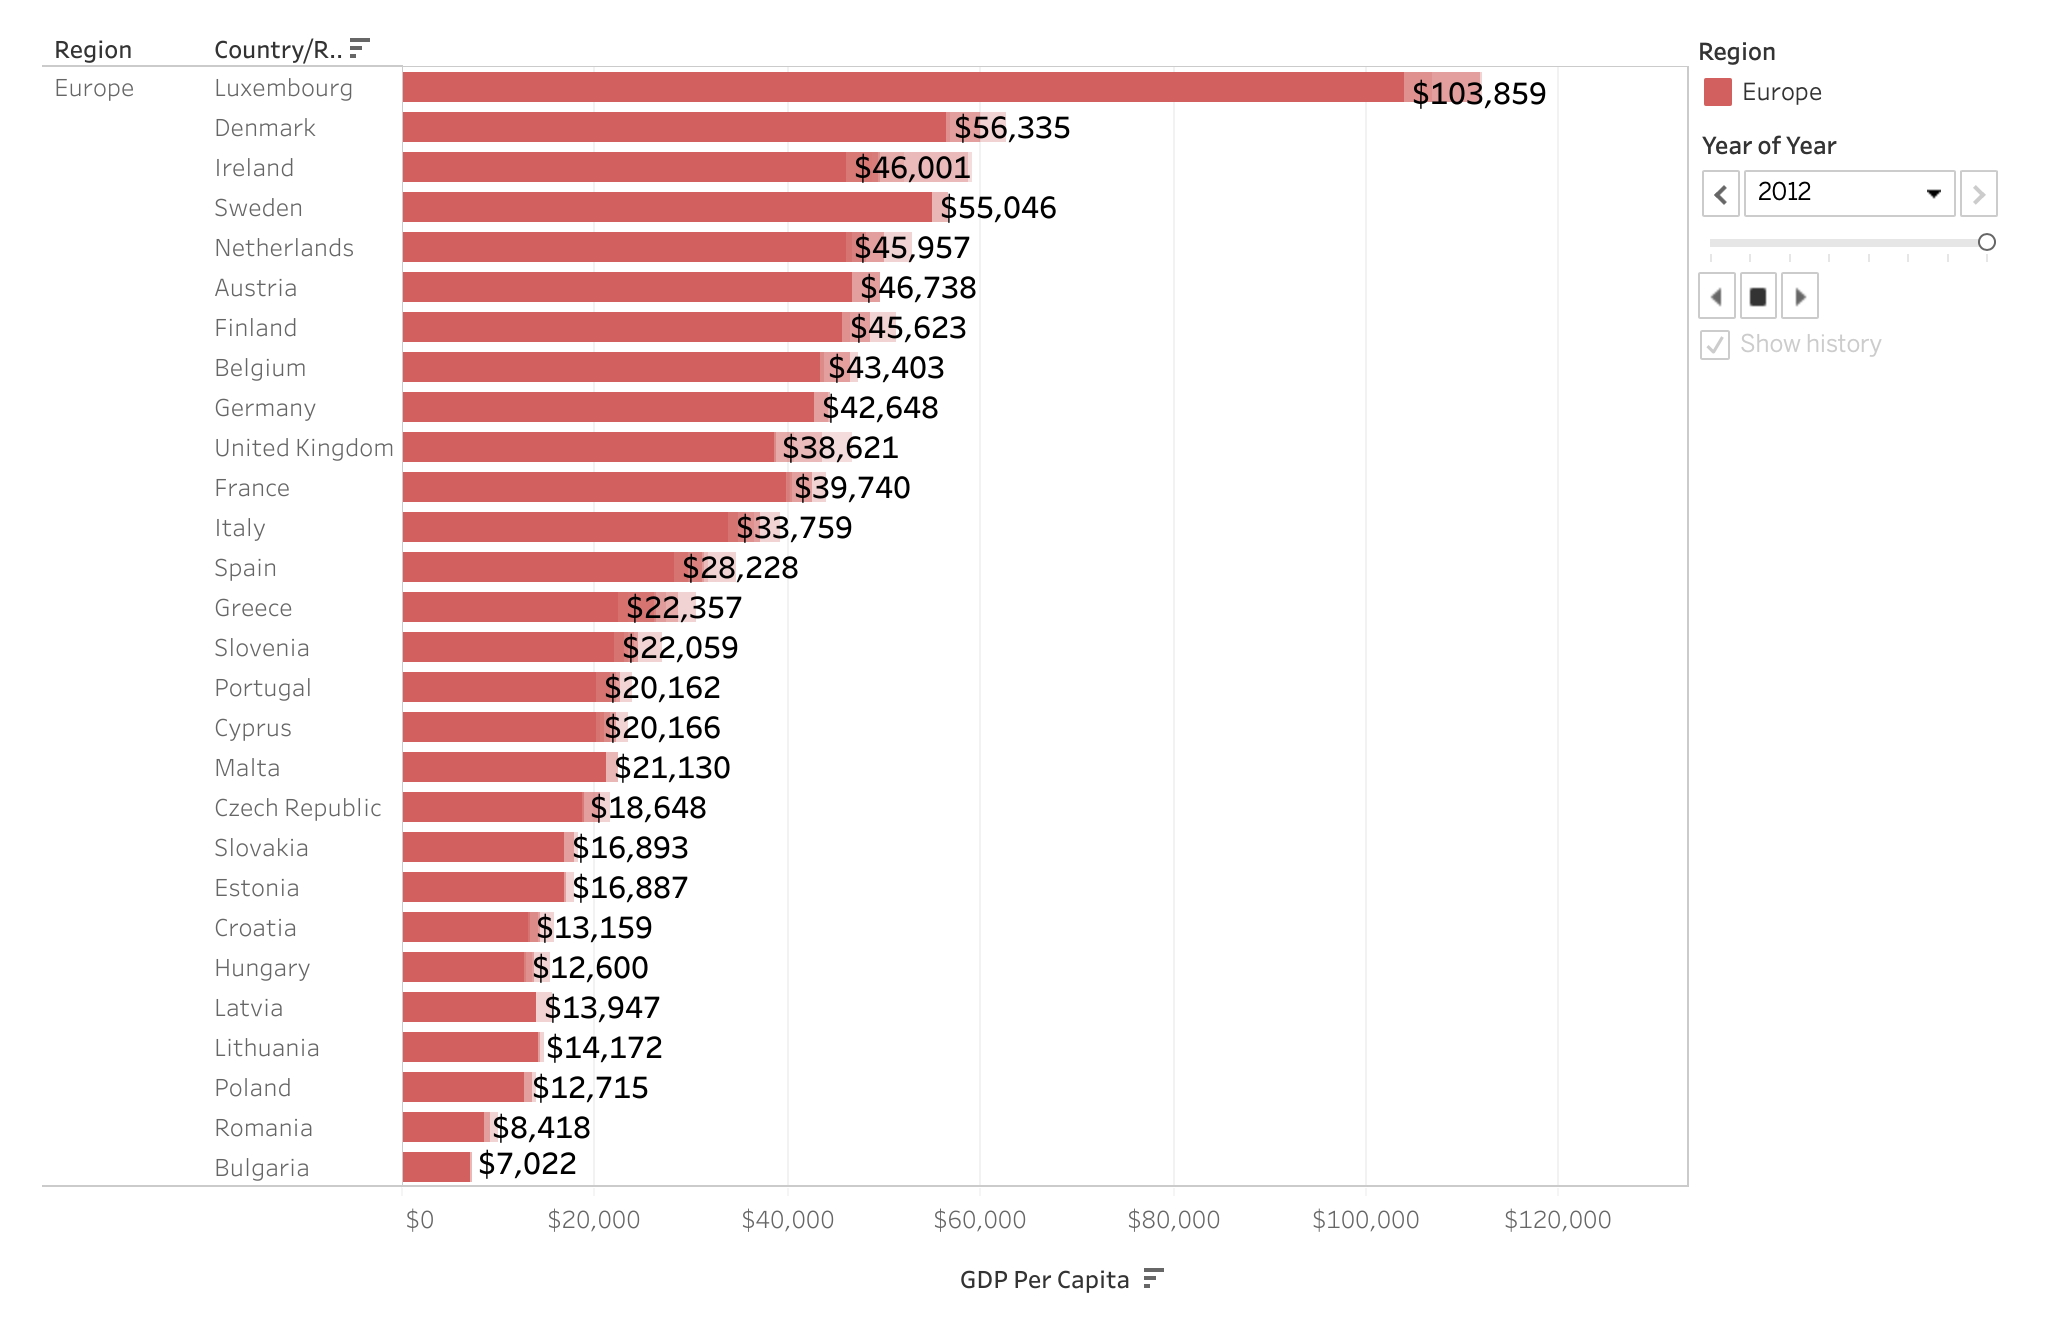
 This is an interactive horizontal bar chart which shows the amount of GDP Per Capita for each EU country over the period of 2005-2012. On average, Luxembourg had remained to possess the highest amount of GDP Per Capita, while Bulgaria kept the record of possessing the least amount of GDP Per Capita.
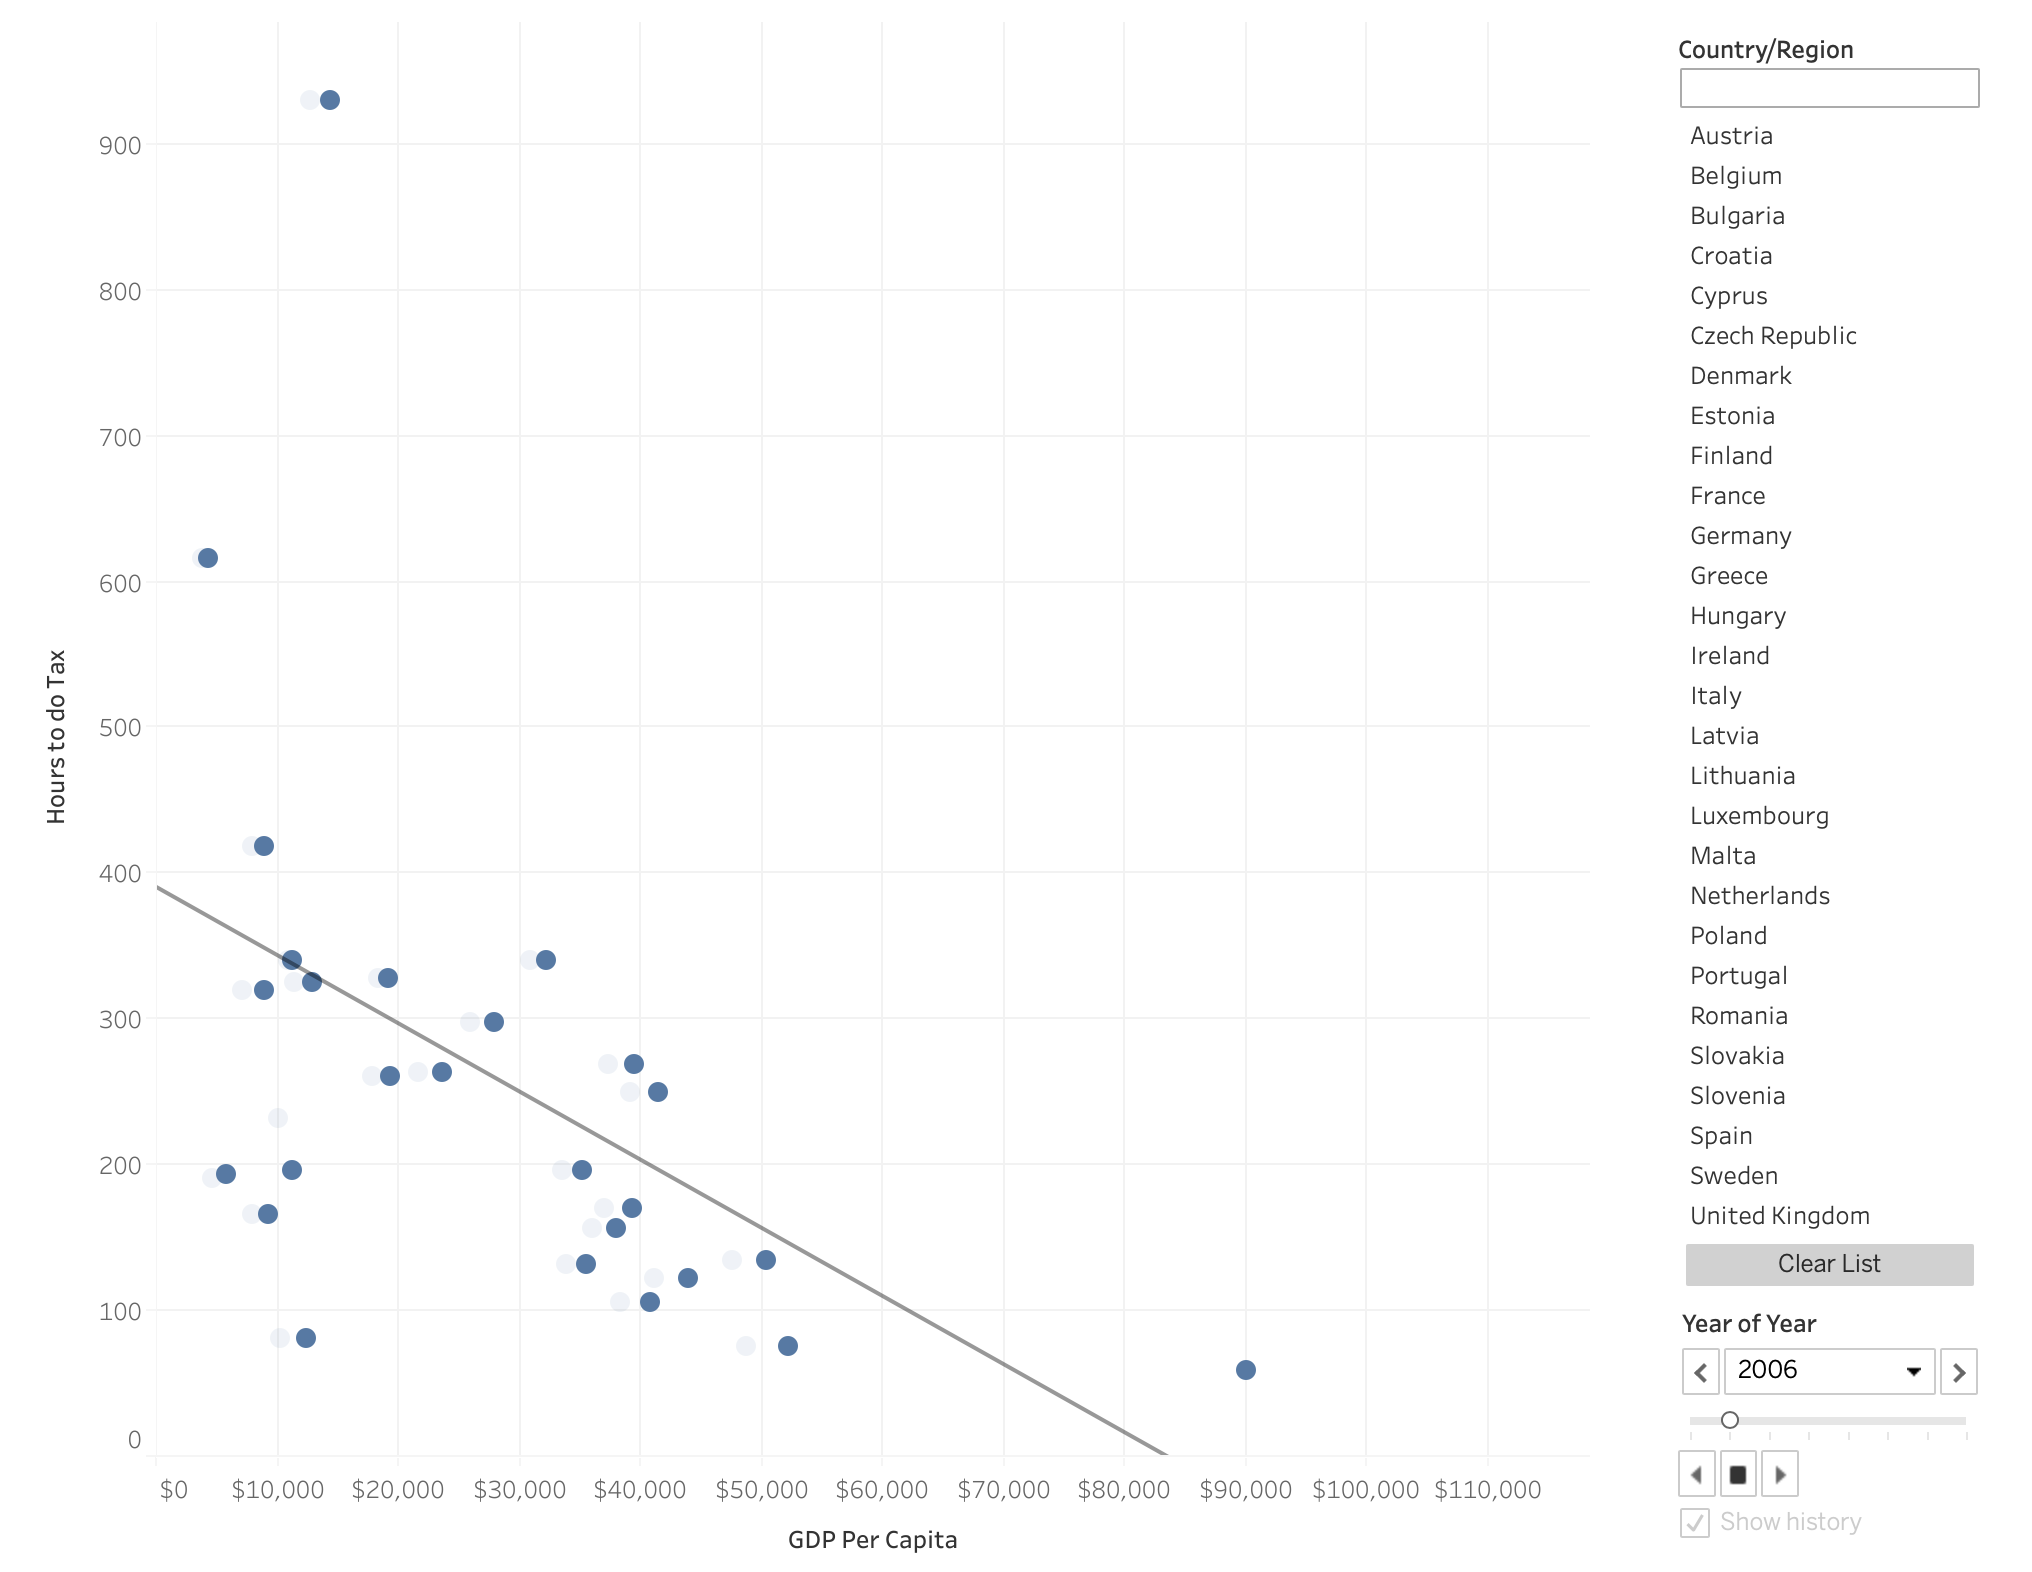
 This is am interactive scatter plot showing the comparison and relationship between the GDP Per Capita and the time taken to do taxes of EU countries. The graph shows a negative correlation; the higher the amount of GDP Per Capita a country possesses, the less amount of hours its citizens have to spend to do taxes.
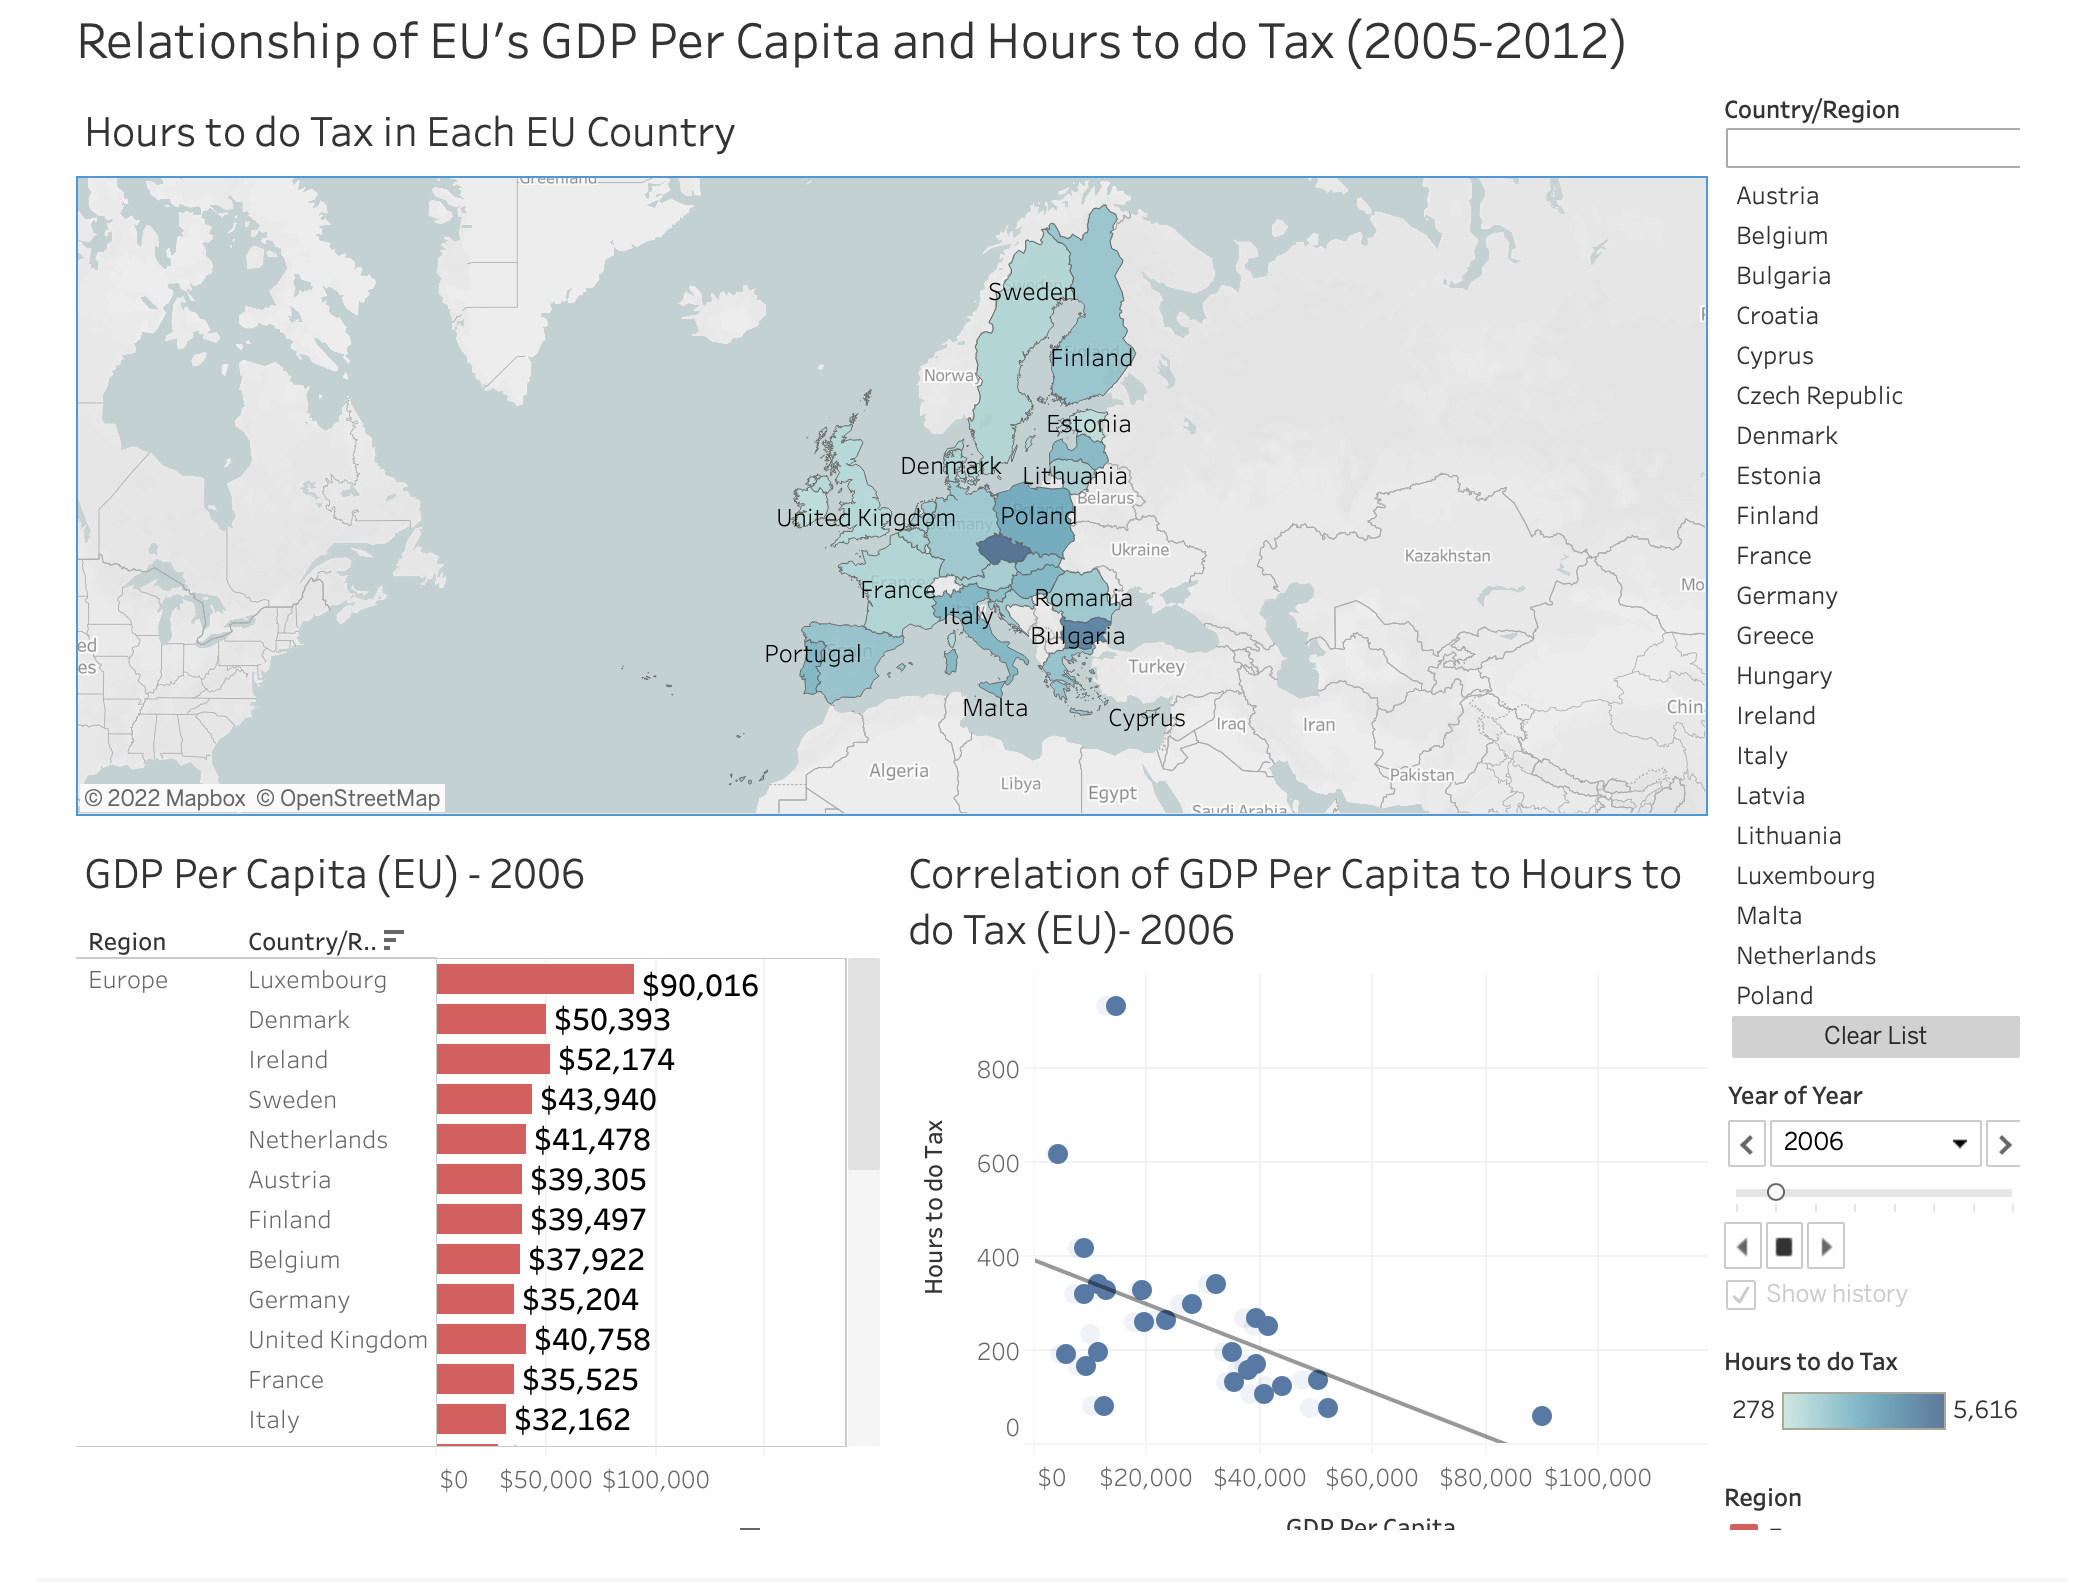
 This is a dashboard which contains all previous charts and graphs.